No software is perfect. Our Apple computers lock up on us. Our Microsoft tablets crash and our Google services give us a “snap! something went wrong error“. It’s something we work hard to avoid but sometimes you may catch a bug and we’d love it if you can help us to fix it so it never happens again.

If you find yourself with a “Something went wrong error” this document will show you how to send us the data we’re looking for.
How to get to the ‘Developer Tools’
The ‘Developer Tools’ is where the error logs are displayed.
- First, ensure you’re using Google Chrome.
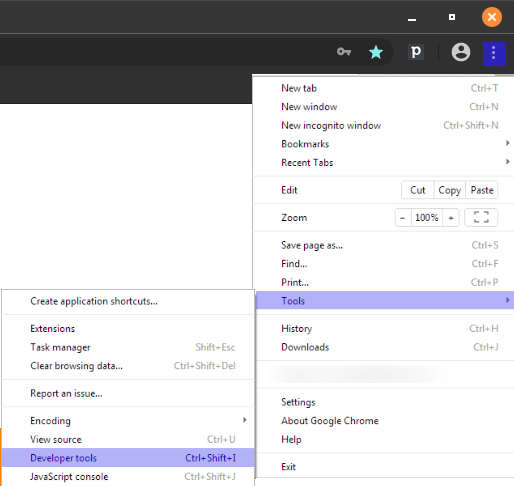
- Select the ‘3 dot menu‘ in the top right corner.
- Select the More Tools option then the Developer Tools option
On a mac computer it may look like this:

On a Windows computer it may look like this:
How to get to the ‘Console’
You will see the following tabs in the window that appears:

- Click on the tab called Console.
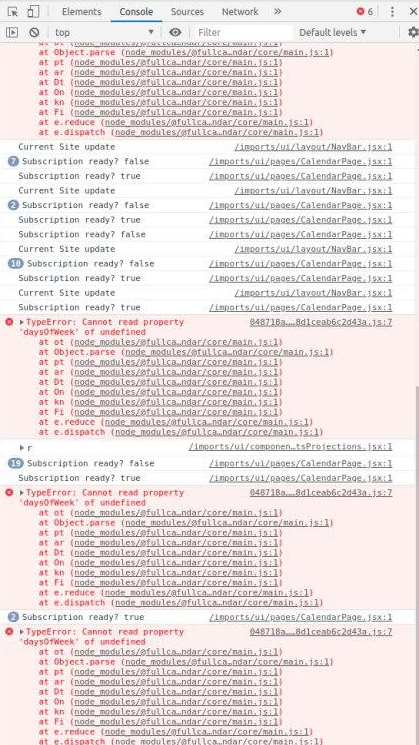
There will be a lot of strange looking text. We are only interested in anything that is in red writing. Black, blue, yellow etc are not errors that we can work with. Only red.
Here is an example:
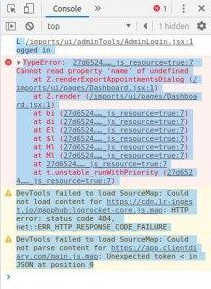
Here is another example:
Copy the logs and put them in a ticket.
- Simply select the Text in Red with your mouse.
- Right click your mouse and choose Copy to copy the text.
- Submit a support ticket and paste the text into the support ticket.
- Please be sure to include what it was you were doing when the error occurred and any other helpful info you can think of.
Once we have this info we can find the exact problem and fix it to stop it happening again.
If you need any help at all with the above process just let us know and we can guide you through it.