The dashboard. It’s been fine for some time now. Fine. But is fine enough?
It should provide more info, useful info, real data. We determined to make it better. Working like the hard little workers we are, we set to it.
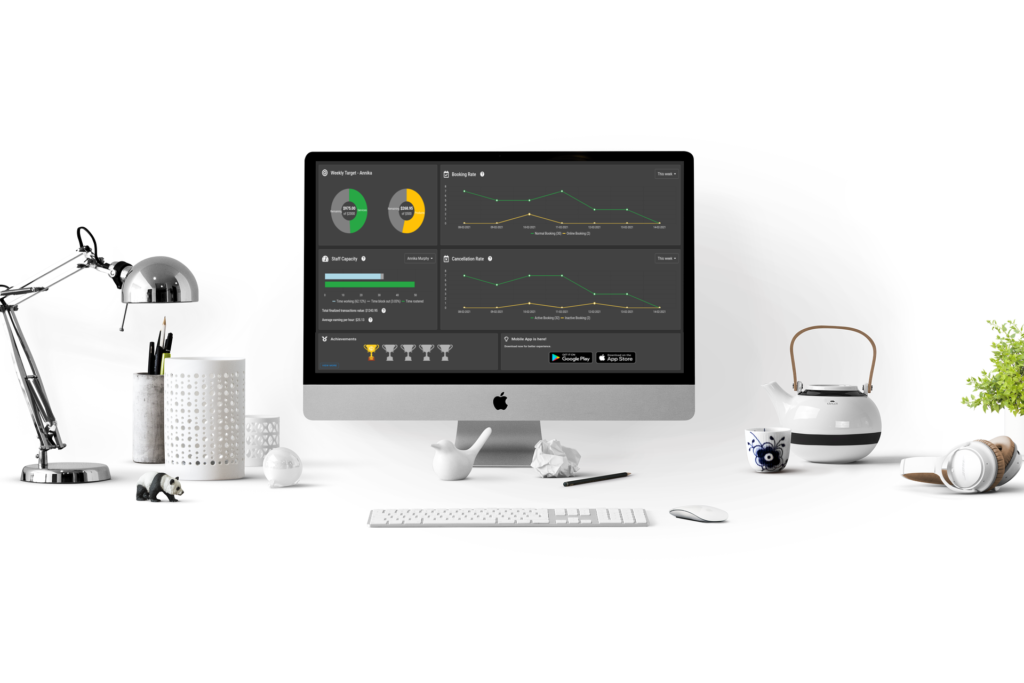
You want to be able to see your operational statistics at a glance and do so in a meaningful way without wading through static reports, spreadsheets or fighting with pen and paper. Visually see the pulse of your business and how it’s performing.
It’s the first revision. It’s been a load of fun to make. You’ll love it. But it’s only the start. For now, head on in and take a look. Load up your Client Diary, head to the Dashboard. Get a feel for what it’s showing you.
To fully read up on what is available to you, if you want to know what the stats mean and how we’ve calculated them, we highly recommend you click on the button below and soak up the knowledge. It’s all there.
We’re sure you’ll love this new addition. It’s the start of a dream, a data dream, that we’ve long had for Client Diary and in time this will expand and improve.
Thanks for all your feedback as usual, keep it coming!
Kind regards,
The Client Diary Team